You’ve got Power BI…why do you need Alteryx ?
Make better dashboards, quicker, by using reliable data, not coding
Like many businesses we use Microsoft Office 365 for our day to day business activities. Driven by COVID, many existing businesses have also moved to the Cloud, and now have access to Microsoft Power BI for data visualisation in dashboards.
Power BI is a good visualisation tool that we and many of our clients use for publishing dashboards. Microsoft’s recent overdue price changes have made it an obvious choice for an organisation to use for its dashboards.
With Power BI connections to Excel it’s a really quick Proof of Concept tool, but … to get reliably accurate results from your real data you need to write code via ;
Excel macros (nope !)
SQL (OK if you have a server and developers, lengthy dev for bad data)
…or even worse, the coding languages hidden away in Power BI and beloved of developers ;
DAX - ergh !
M - double ergh !
R - triple ergh !
Dan quickly found this out in the early days of Continuum when delivering a payroll budgeting project using PowerQuery. He needed to pull together employee details from the Dynamics ERP system, blend with confidential salary, bonus, allowance and assessment data and create a single report for use only within the HR department and ExCo, which ruled out a data warehouse/reporting database.
Version 1 was a success, but as modifications and enhancements were added the model became less stable and impossible to maintain.
This is a common problem with dashboard tools that look great in preview but either never quite reach production, or don’t reconcile with other reports and dashboards.
Dan took that as the cue to check out the modern no-code/low-code tools that focused on repeatable data quality…and happily found Alteryx !
One of our first projects was replacing the above PowerQuery process with Alteryx Server for vastly improved performance and supportability - it remains in production now.
Some other Alteryx/Power BI examples from our clients ;
Jersey Telecom won a UK marketing excellence prize using Alteryx to collect Customer Experience data from multiple platforms to present to stakeholders via Power BI.
Jersey’s Hospital Waiting lists are also generated by Alteryx from multiple sources then presented via Power BI.
TMF Group’s excellent Automation Tribe was trained on using Alteryx to make Excel/Power BI reporting more robust, and use it constantly.
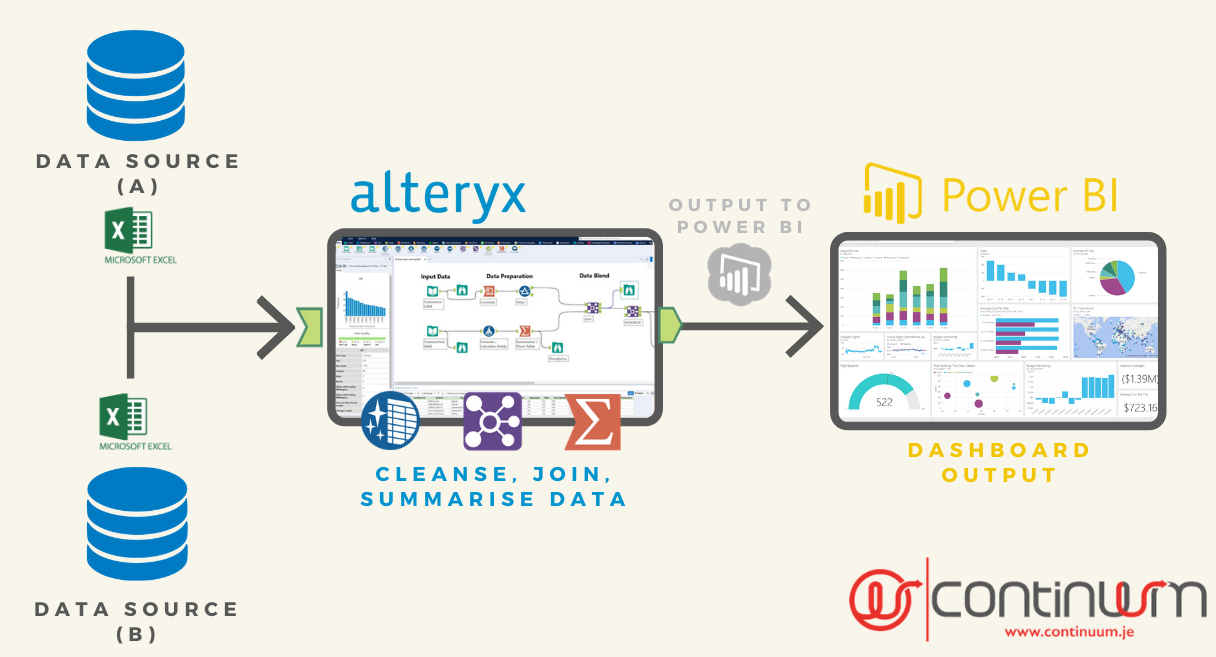
As George from our team demonstrated at our recent Alteryx User Group video and in an indepth Power BI video, you can refresh Power BI dashboards from Alteryx in two ways ;
Generate an accurate, clean, data-only Excel spreadsheet in SharePoint/OneDrive, then any Power BI dashboards based on that sheet will refresh with accurate data.
Refresh a Power BI dashboard directly, optionally with supporting spreadsheet output at the same time.
We recommend also generating the supporting spreadsheet since research shows that most people look at a Power BI dashboard then save into Excel anyway, and then use VLOOKUP’s to bring in data from other sources for analysis.
In summary, businesses are on the right track with Power BI to get away from sharing complicated Excel reporting spreadsheets. However, they need to take the extra step with Alteryx to use their actual, mixed quality data to present what stakeholders need to run the business better.


